We at Mellowhost has been utilizing R1Soft CDP backup for last 8 years. R1Soft has been a great backup tool even though the tool is immensely resource hoggy. At different times we had gone through different situations to handle our backup servers efficiently. After all the hiccups with backup nodes, we ended up efficiently configuring 3 backup servers of 3 different configuration
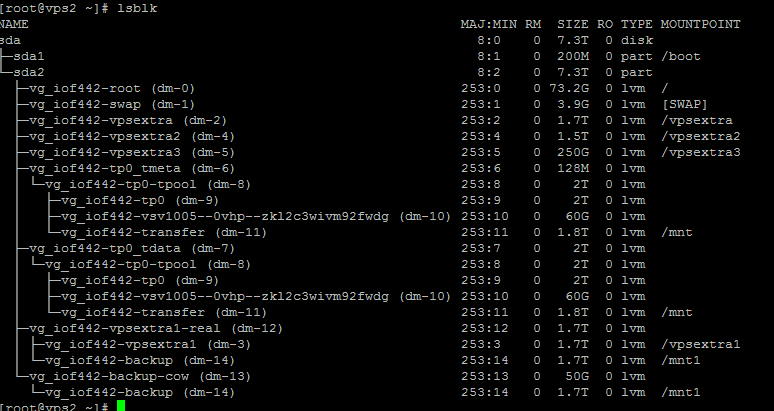
- backup1 = It contains 12TB file system on a RAID 0 array. It copies data to a BTRFS compressed drive once a week to keep the data safe if RAID 0 dies. This server uses RAID 0 for faster drive verification and block scanning by r1soft. This server hosts servers that requires frequent backing up and can sustain a loss of a week data (Less important data). As the server performs really fast due to being RAID 0, we can run multiple r1soft threads at a time including disk safe verification and block scans.
- backup2 = It contains 30TB file system in RAID 6 hardware array. This is used for hosting our VPS backups. This server is a seriously large one to keep backups of our enterprise VPS clients.
- backup3 = It contains 16TB file system in RAID 10 hardware array. This server is hosted in a East Coast American Location. It is our off network backup server and keeps backups for East Coast servers too.
One of the key factor in designing a backup server is the size and the location. Need to keep in mind that CDP 3 takes more space than CDP 2 for unknown reason while still being a differential backup solution, not just an incremental. Location of the server matters due to the network speed. If you are hosting your server a lot far than the server network, it may take longer time to complete the initial storage. Due to the latency it may fails to perform as fast like 1Gbps even if both network supports it. Just for an example, if you are backing up your data at 1MBps speed, it would take 12.13 days to complete backup of 1TB data [ Calculation: (((1024 x 1024) / 60) / 60) / 24 = 12.13 days ]. A 100Mbps port can give you speed upto 10MBps, while you can have 50MBps+ speed if you are using a 1Gbps network roughly. So why does the speed matter? If you are backing up your initial data in 13 days, that doesn’t mean it will be the same all the time. Your second backup would take much less amount of time as it only needs to upload the differential backups. That is true! But the problem will come when you require to do a bare metal restore. If your server requires a disaster recovery, you would then need 13 days to restore your server to the original state. Your customers won’t sit down for 13 days! While creating backup, it is important to think about disaster recovery too. How fast are you going to be able to restore the backup is an important concern while designing your disaster recovery solution.
I always recommend users to choose a 1Gbps network with a latency below 2ms if you want to have a good disaster recovery solution. This can guarantee a faster bare metal restore when needed.
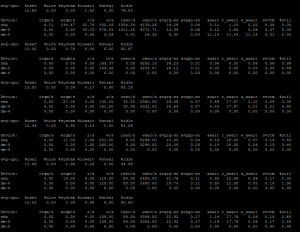
The second key factor while creating the R1soft backup server would be to choose the RAID. If you are thinking to create r1soft backup on a non-raided solution, I think you should drop off your idea. RAID isn’t necessarily always use to keep your data safe, it can also be used for performance. Keeping a RAID 0 or striping in general is must for a R1Soft server. Otherwise, every couple of times, you are going to see a lot of stalled processes doing ‘disk safe verification’ ‘block scan’ etc etc and not able to keep the backup up to date or canceling processes due to duplicate backup process (Old one taking too long to complete). It is better not to choose RAID 5. I particularly didn’t try RAID 5, but I have used RAID – Z on ZFS file system, which was seriously slow for my work around. I switched the server later on to RAID 0 and BTRFS compression to keep a weekly backup which tremendously improved the R1Soft performance. We at later time, worked to create more backup servers with hardware RAID WB cache and battery backed unit to give us more performance benefit while creating and restoring backups. These servers have been performing tremendously well with R1Soft. They can also be called good disaster recovery node.
Last, I recommend you to understand that backup isn’t just keeping a copy of your data of your online existence. It is important to design a disaster recovery solution instead of just creating backups. If you are simply into creating backups, you probably don’t need R1Soft or any high end servers instead simple Rsync would work fine. But to create ‘Disaster Recovery’ solution, you need high level planning, good hardwares and good cost estimation. If you are leaving behind in any, you will probably fail to create a good disaster recovery solution that actually ‘works’.