Question: How to find iops usage of a linux server?
Answer: Use iostat. Iostat is a tool comes with the ‘sysstat’ package. If you type iostat on your CentOS/Redhat server and it says the command not found, you can install sysstat to avail the iostat command.
yum install -y sysstat
An example iostat usage case could as simple as following:
iostat -x 1
-x tells iostat to give extended statistics which is required to find read/write iops individually. And the 1 tells iostat to repeat the command every 1s.
An example output would be like the following:
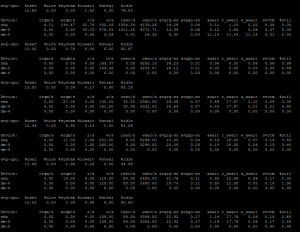
If you look at the output, the colum r/s would say the read iops and the colum w/s would say write iops. If you are using simple ‘iostat 1’ then the column tps should show the total iops of the disk in use.
If you are using a spinning disk, and if you are getting anything around 150-200 cumulatively, you are probably hitting the iops limit. With raid, the number would change according to your raid choice. Although, the number can increase in case of using Writeback SSD Cache, Hardware RAID Cache or Pure SSD disks. Most important benefit of using SSD is not essentially the amount of throughput it gives in a practical environment instead the amount of IOPS it can sustain is phenomenal.