How to Add Openlitespeed Server to Haproxy – Avoid 503 Haproxy Error

For past one month, Openlitespeed has been my favorite piece of web server. Litespeed has always outperformed all the other webservers including Nginx as well in any of my production environment. But I have recently switched to using OLS which is a Opensource version of Litespeed with some limited features. I get LS kind of performance along with no worry for paying. How better could it be?

OLS comes with some weird problem. As OLS is less used, finding a solution for such cases could be difficult. I faced a very similar kind of issue yesterday.

I added a OLS based server to my HAProxy cluster, but the HAProxy can not find the OLS server working. When I try to access the web app hosted under OLS server using local IP masking, I see the website without a problem. That means, OLS is interpreting the Domain with IP relation well. But failing to respond when Haproxy is requesting through IP address.

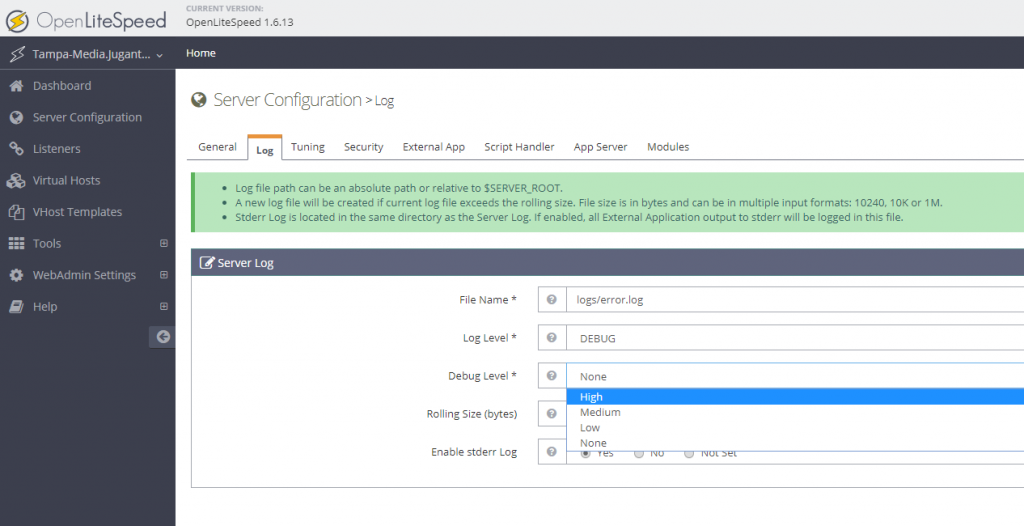
The problem is, OLS is not configured to respond to ‘default’ requests on ‘127.0.0.1’, ‘localhost’ or the server’s main IP. To find out this, I enabled ‘High’ Debug mode of OLS. To do this, first visit the OLS Webadmin Console, it can be accessed with https://IP:7080

After login, go to Server Configuration >> Log >> Edit Server Log >> Set ‘Debug Level’ to High and Save

Set high debug level in openlitespeed

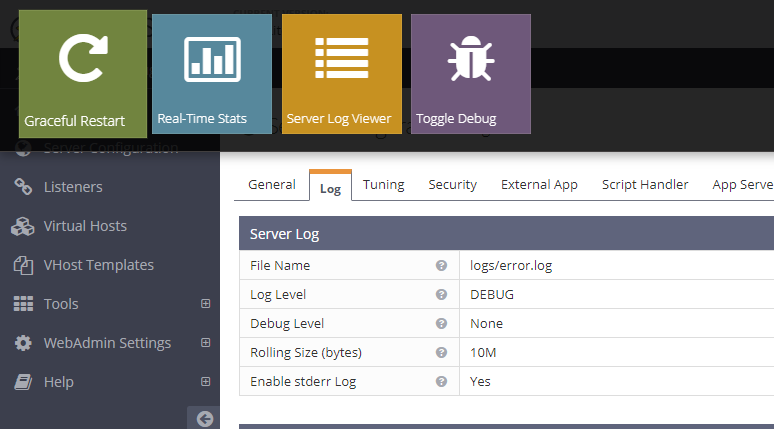
Once saving is done, you may gracefully restart the OLS

Gracefully restart Openlitespeed

Once this is done, you may now monitor the error.log file located usually under /usr/local/lsws/logs. Now tail the output of error.log while processing requests with Haproxy:

tail -f /usr/local/lsws/logs/error.log

You can see, OLS has returned 404 error for the localhost/ request. That means, Haproxy is requesting the IP with a header ‘localhost/’, and the server should return something with code 200 to make sure the server is in business.

What we need to do, is to make OLS respond to request for basic IP and localhost to 200 with the main site instead of ‘404’ error. To do this, we need to go to Webconsole of OLS again >> Listeners

You will see you have two Listeners, one for Default/Non HTTP and the HTTPS/SSL. In my case, I was using only HAProxy to Origin with no SSL, means 80. I selected the Default.

Open 80 Listener View in Openlitespeed

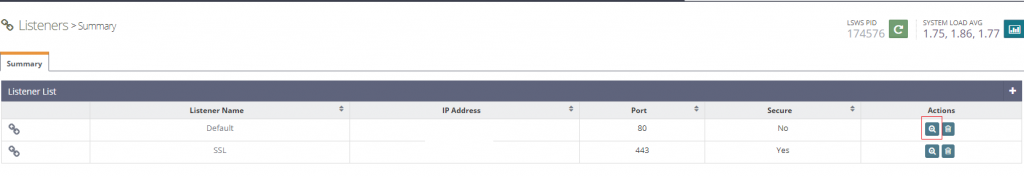
In the Listener List, you can find your Virtualhost, click on the ‘Edit’ of your Virtualhost

Virtualhost Edit Openlitespeed

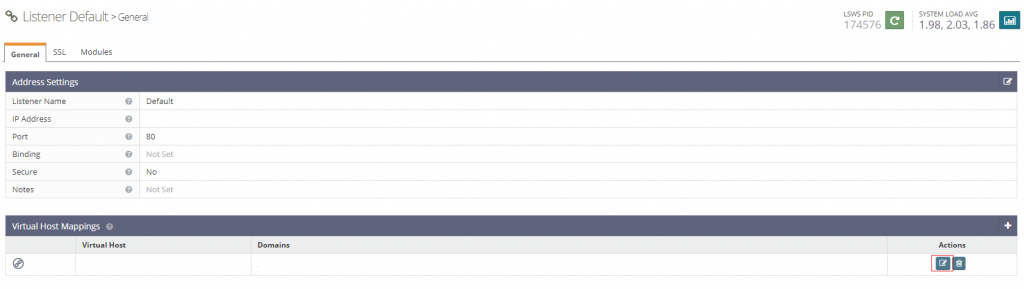
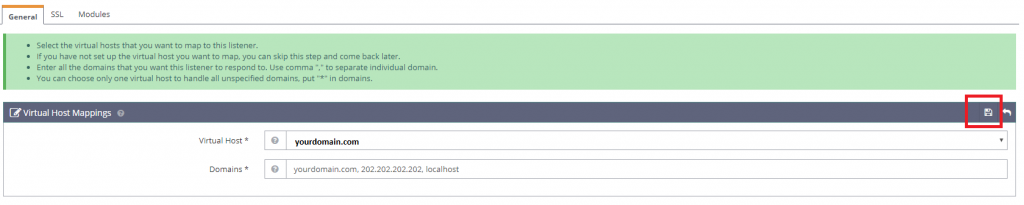
Now, you can map the virtualhost. You will see your primary domain as the ‘Virtual Host’, which can’t be changed here. But what you can do is to map this virtualhost to several domains. The trick is to add your server’s IP and the localhost in the ‘domains’ list with comma seperation as following:

localhost mapping to OLS

Once this is saved, restart your OLS and now your HAProxy should be able to read requests and starting forwarding requests to your OLS server.

How to: Setup a server for R1Soft CDP backup?

We at Mellowhost has been utilizing R1Soft CDP backup for last 8 years. R1Soft has been a great backup tool even though the tool is immensely resource hoggy. At different times we had gone through different situations to handle our backup servers efficiently. After all the hiccups with backup nodes, we ended up efficiently configuring 3 backup servers of 3 different configuration

  1. backup1 = It contains 12TB file system on a RAID 0 array. It copies data to a BTRFS compressed drive once a week to keep the data safe if RAID 0 dies. This server uses RAID 0 for faster drive verification and block scanning by r1soft. This server hosts servers that requires frequent backing up and can sustain a loss of a week data (Less important data). As the server performs really fast due to being RAID 0, we can run multiple r1soft threads at a time including disk safe verification and block scans.
  2. backup2 = It contains 30TB file system in RAID 6 hardware array. This is used for hosting our VPS backups. This server is a seriously large one to keep backups of our enterprise VPS clients.
  3. backup3 = It contains 16TB file system in RAID 10 hardware array. This server is hosted in a East Coast American Location. It is our off network backup server and keeps backups for East Coast servers too.

One of the key factor in designing a backup server is the size and the location. Need to keep in mind that CDP 3 takes more space than CDP 2 for unknown reason while still being a differential backup solution, not just an incremental. Location of the server matters due to the network speed. If you are hosting your server a lot far than the server network, it may take longer time to complete the initial storage. Due to the latency it may fails to perform as fast like 1Gbps even if both network supports it. Just for an example, if you are backing up your data at 1MBps speed, it would take 12.13 days to complete backup of 1TB data [ Calculation: (((1024 x 1024) / 60) / 60) / 24 = 12.13 days ]. A 100Mbps port can give you speed upto 10MBps, while you can have 50MBps+ speed if you are using a 1Gbps network roughly. So why does the speed matter? If you are backing up your initial data in 13 days, that doesn’t mean it will be the same all the time. Your second backup would take much less amount of time as it only needs to upload the differential backups. That is true! But the problem will come when you require to do a bare metal restore. If your server requires a disaster recovery, you would then need 13 days to restore your server to the original state. Your customers won’t sit down for 13 days! While creating backup, it is important to think about disaster recovery too. How fast are you going to be able to restore the backup is an important concern while designing your disaster recovery solution.

I always recommend users to choose a 1Gbps network with a latency below 2ms if you want to have a good disaster recovery solution. This can guarantee a faster bare metal restore when needed.

The second key factor while creating the R1soft backup server would be to choose the RAID. If you are thinking to create r1soft backup on a non-raided solution, I think you should drop off your idea. RAID isn’t necessarily always use to keep your data safe, it can also be used for performance. Keeping a RAID 0 or striping in general is must for a R1Soft server. Otherwise, every couple of times, you are going to see a lot of stalled processes doing ‘disk safe verification’ ‘block scan’ etc etc and not able to keep the backup up to date or canceling processes due to duplicate backup process (Old one taking too long to complete). It is better not to choose RAID 5. I particularly didn’t try RAID 5, but I have used RAID – Z on ZFS file system, which was seriously slow for my work around. I switched the server later on to RAID 0 and BTRFS compression to keep a weekly backup which tremendously improved the R1Soft performance. We at later time, worked to create more backup servers with hardware RAID WB cache and battery backed unit to give us more performance benefit while creating and restoring backups. These servers have been performing tremendously well with R1Soft. They can also be called good disaster recovery node.

Last, I recommend you to understand that backup isn’t just keeping a copy of your data of your online existence. It is important to design a disaster recovery solution instead of just creating backups. If you are simply into creating backups, you probably don’t need R1Soft or any high end servers instead simple Rsync would work fine. But to create ‘Disaster Recovery’ solution, you need high level planning, good hardwares and good cost estimation. If you are leaving behind in any, you will probably fail to create a good disaster recovery solution that actually ‘works’.

How to: Find IOPS usage in a Linux Server

Question: How to find iops usage of a linux server?

Answer: Use iostat. Iostat is a tool comes with the ‘sysstat’ package. If you type iostat on your CentOS/Redhat server and it says the command not found, you can install sysstat to avail the iostat command.

yum install -y sysstat

An example iostat usage case could as simple as following:

iostat -x 1

-x tells iostat to give extended statistics which is required to find read/write iops individually. And the 1 tells iostat to repeat the command every 1s.

An example output would be like the following:

If you look at the output, the colum r/s would say the read iops and the colum w/s would say write iops. If you are using simple ‘iostat 1’ then the column tps should show the total iops of the disk in use.

If you are using a spinning disk, and if you are getting anything around 150-200 cumulatively, you are probably hitting the iops limit. With raid, the number would change according to your raid choice. Although, the number can increase in case of using Writeback SSD Cache, Hardware RAID Cache or Pure SSD disks. Most important benefit of using SSD is not essentially the amount of throughput it gives in a practical environment instead the amount of IOPS it can sustain is phenomenal.

Quick How To: Finding IO Abuser in KVM VM

I thought to write a quick how to on finding an abuser in a KVM VM Host. There is a tool shipped with libvirt is called ‘virt-top’. Virt-top  has many usage case. It can be used to detect the IO Abuser. Most of the cases, you would see the abuser is throwing a lot of IO Requests regardless of the amount of IO being written or read. Which is why, it important to first identify if you are hitting the IOPS limit of your disk or not by using iostat. A common tool I regularly use to identify first hand disk problem is iotop as well. The following is the favorite iotop command:

iotop -oaP

-o will only show the threads that are actually doing IO in the server instead of all the sleeping threads, keeping the iotop result clean. ‘P’ will show only the processes instead of every single threads. Each VM can have thousands of threads which will show up on the process ID. ‘a’ is specifically my favorite, that does accumulated output. It will show you the sum of the usage for the time your interactive iotop is running.

Once you are done with the first hand investigation, you may now use virt-top to detect the VM activity further. A most used command for me to detect IO abuser is the following:

virt-top -3 –block-in-bytes -o blockwrrq

-3 tells the virt-top to find block device usage and find them by ‘bytes’ while the -o ‘blockwrrq’ means to sort the output by the write iops of the VM. You can use blockrdrq to sort the result by read iops too.

Once you can mix the output of virt-top and iotop results, you shouldn’t have difficulty to detect the VM that is abusing the IO on the server.

Backing up LVM Cache Volume?

I have been trying to explore what options do we have to use SSD Cache with a HDD driven servers to create faster writes. There are both software and hardware solutions. Hardware solution comes to CacheCade which isn’t really costly at all (roughly costs 250$ extra per license), though I was interested to explore all the software solution that are currently available in the market.

There are bcache, flashcache & lvm cache, that are mostly used in production servers. I firstly discarded bcache because it requires you to format the disk with bcache, that triggers the less flexibility check for a module. I tried flashcache before, and don’t want to go with it in a production server any longer as the module is discontinued (It still works, don’t get me wrong). All it seems, lvm cache is the only one which is stable and going to improve over days.

LVM Cache does work great. With the smq lvm cache policy, writeback cachemode & deadline scheduler, you can reach 220MBps write speed with Intel SSD in RAID 1, which is normally available in a RAID 1 Intel SSD. You can double the speed by putting a RAID 10 SSD array to back the cache. Although, after all the test was done, I realized that lvm cache doesn’t support snapshot unfortunately. At least not yet, at the time I am writing the blog. Without the snapshot facility, the performance benchmark actually goes in vain.

Snapshots of cache type volume vg0/newvz is not supported.

Hardware solutions are always useful as the backend setup goes transparent to the OS, which allows us to use our own tool without worrying about the caching setup. Cachecade is probably the only available solution right now with all facilities for SSD cache in production servers.

Check File System for Errors with Status/Progress Bar

File system check can be tedious sometimes. User may want to check the progress of the fsck, which is not enabled by default. To do that, add -C (capital C) with the fsck command.

fsck -C /dev/sda1

The original argument is:

fsck -C0 /dev/sda1

Although, it would work without number if you put the -C in front of other arguments, like -f (forcing the file system check) -y (yes to auto repair). A usable fsck command could be the following:

fsck -fy -C0 /dev/sda1

or

fsck -C -fy /dev/sda1

Please note, -c (small C) would result a read only test. This test will try to read all the blocks in the disk and see if it is able to read them or not. It is done through a program called ‘badblock’. If you are running badblock test on a large system, be ready to spend a large amount of time for that.

Why does Your New Site Take Ages to Load?

I was trying to track down a couple of website slow down reports lately. There is an interesting change of slow down behaviour these days in web application. From a conventional standpoint, people firmly believes that their static contents are not going to affect the performance of their websites other than images being heavy.
 
In reality, they are ignoring the fact that they are using jQuery plugins of many kinds from multiple developers. Hence cumulative number & sizes of JS files are pretty large these days comparing with all the plugins were coming from a single developer. Once the number of static file increases and goes beyond 100 per page, a cookie domain can hit some serious performance penalty. Geolocation for these small files and accessing them from single source can also increase the time geometrically. There is undoubtedly a large market of CDN due to the nature of development in web application.
 
I have seen, people these days are more aware about handling large data wisely than before. If you are using a Cloud from any provider, you are possibly using an E5 core or multiple (Mellowhost uses only E5 nodes right at this moment), that usually comes with access to a 16/24/32MB cache. Your static handling going to be more important in performance on these type of resources than your database, as threading is more of a concern than a single process handling in these virtualised resources.

Best Method to Reboot Linux

There are multiple ways to restart a remote linux system. A IPMI restart, a Power Strip or a Command Restart.

What is the best method to restart a Linux system?

The best method to restart a linux system is to graceful command restart. This will always make sure your all the services are closed before a restart. It will unmount the system and process a shutdown. If a system is not cleanly unmounted, this can cause data loss or some serious injuries to the drive. An uncleanly unmounted system can also take extra time to reboot due to file system integrity check and file system quota check. A cleanly unmounted system would skip the both check and restarts fast. It is hence recommended not to use a forceful Linux restart which doesn’t unmount the system cleanly.

Continue reading “Best Method to Reboot Linux”

A Brilliant App Optimization/Monitoring Tool – New Relic!

Almost 24 hours ago, one of my friend referred to me an interesting offer from ‘tutplus’

http://dev.tutsplus.com/articles/get-a-free-year-of-tuts-premium-by-trying-new-relic–cms-12

It seems Tutplus either affiliated or owned a new App optimization tool named “New Relic”. My primary objective was of course to get the free Tut+ Premium for a year and the Nerd T-shirt, and whats hard in deploying a PHP App Monitoring tool in one of the server! So I started.

The deployment of the tools are fairly easy. I am not really in the Mobile App thing, so I had chosen the PHP Web App monitoring tool. The deployment is well instructed. Its a RPM based installer for RHEL based releases, pretty clean and simple. Once the installation was done, it added a shared object in my PHP interpreter and started grabbing data. Out of a surprise, I started seeing details that are really cool. Things like “Errors” and “Stack Trace” are the finest invention of this tool. The Stack trace gives you reports like “strace” which is my favorite tool of linux debugging facility. The basic advantage of this feature in New Relic is, it saves the data and post you as a token in the dashboard of new relic. Now, isn’t it brilliant? I sorted almost 23 major bugs in client’s account since I have installed the monitor. Database monitoring also includes some exceptional features that are not usually available in App Monitoring/Optimizations tools I had used before.

Unfortunately, the tool is free for 2 weeks. Since then, the “Pro” version comes with 150$ a month per host. The price is certainly high, but the result is truly amazing, looking at the features and performance of the tool.

At the end of all, I had my Tut+ premium for one year for free of charge and a nerd T-shirt on the way to my home 😀

If you haven’t tried it, you can try it now. If you are an android developer, you can add the code in your app, and monitor your App for 14 days for free, and get a Tut+ premium for free for a year.

Just for a record, I am not affiliated with neither Tut+ nor New Relic. The link should not contain any affiliate url.

Happy troubleshooting!