SMTP Error: 550 Please turn on SMTP Authentication in your mail client – IP is not permitted to relay through this server without authentication

We had a customer complaining about a commonly seen error of the following type:

550 Please turn on SMTP Authentication in your mail client. mail-pf0-f172.google.com [209.85.192.172]:38632 is not permitted to relay through this server without authentication.

Diagnostic-Code: smtp; 550-Please turn on SMTP Authentication in your mail client. 550-mail-pf0-f172.google.com [209.85.192.172]:38632 is not permitted to relay 550 through this server without authentication.

reason: 550-Please turn on SMTP Authentication in your mail client.
550-mout.kundenserver.de [212.227.17.24]:49392 is not permitted to relay
550 through this server without authentication.

They were all basically the same error. This is a common error and the solution is pretty simple as it looks like. Enabling ‘SMTP Authentication’ on the outlook or the mail client should solve the problem. But interestingly, the client was smart and he wasn’t doing any mistake with ‘SMTP authentication’. The error was actually showing up when someone was trying to send the mail to him (As a receiver SMTP). We then tried digging the error further.

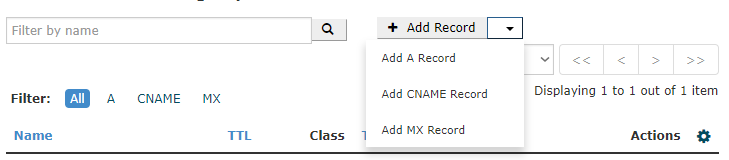
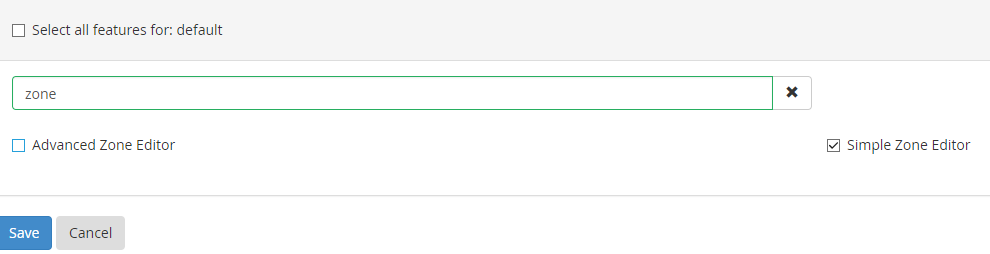
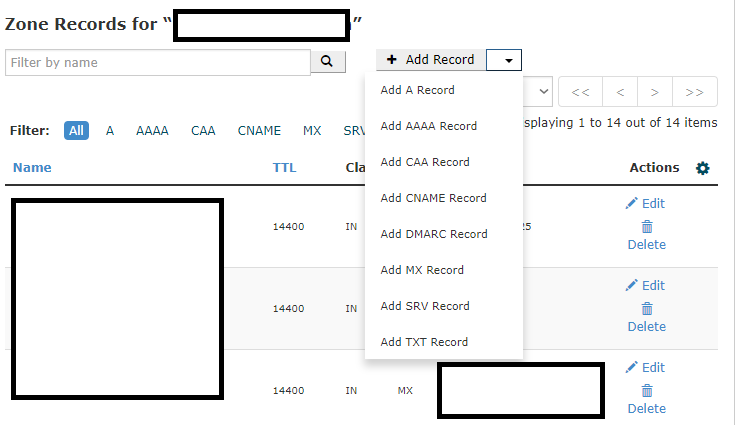
There is something we need to remember. SMTP is not only authenticated using username and password, it also goes through a dns authentication check too. If your dkim/domainkeys/spf/dmarc do not match as the mail server has advised, the mail will get denied with the same type of error (Error code 550). We then realized the customer account was transfered earlier from a different server and the old domainkeys were still there in it’s DNS zone file. As domainkeys are RSA keys generated per server, it is important to regenerate the keys after the server change. Otherwise, the old key check through the DNS can trigger the 550 error from the receiver relay. We had deleted and generated a new domainkeys for the customer and the error went off.

phpMyAdmin Coming Blank in Cpanel

One of the customer reported an issue related to phpMyAdmin earlier today. He was getting a blank page of phpmyadmin that only says “Welcome to phpMyAdmin”

Once I hoped into the ssh and checked the cpanel error log file located under

/usr/local/cpanel/logs/error_log

I observed the following error:

PHP Fatal error: require_once(): Failed opening required './libraries/display_select_lang.lib.php' (include_path='/usr/local/cpanel/3rdparty/php/56/lib/php:.') in /usr/local/cpanel/base/3rdparty/phpMyAdmin/libraries/plugins/auth/AuthenticationCpanel.php on line 147

The error was peculiar because display_select_lang.lib.php wasn’t available in any other cpanel phpmyadmin source files I searched. Then I realized “AuthenticationCpanel.php” mentions the error which usually because Cpanel Authentication wasn’t done properly with the MySQL. Cpanel pass wasn’t synced with the MySQL.

Going to WHM >> Password Modification >> If you select the user and WHM shows you the ‘Sync with MySQL Password’ option, that means the MySQL password is outdated to cpanel and requires syncing (NB: If the password doesn’t require syncing, this option won’t be there). You can reset the pass and check the option to Sync the new pass with MySQL. That should restore your phpmyadmin.

Linux: Disable On-Access Scanning on Sophos AV

We use Sophos AV instead of ClamAV in couple of our linux servers. Sophos comes with on access scanning that uses a kernel module to trigger which file has been accessed unlike ClamAV which only come with signature and a basic scanning tool by default. It has it’s own benefit while drawbacks too. You have to give a certain amount of resources for Sophos. There are times, when you may require to disable the On Access Scanning on Sophos AV to diagnose different issues with the server.

To disable on access scanning on sophos AV, run the following from your terminal/ssh console:

/opt/sophos-av/bin/savdctl disable

To re-enable on access scanning on sophos AV, run the following:

/opt/sophos-av/bin/savdctl enable

Sophos log file is located here:

/opt/sophos-av/log

Sophos comes with multiple control binaries. They can be found at the following directory:

/opt/sophos-av/bin

You can find sophos binaries available at the man page too:

man savdctl

How to: Setup a server for R1Soft CDP backup?

We at Mellowhost has been utilizing R1Soft CDP backup for last 8 years. R1Soft has been a great backup tool even though the tool is immensely resource hoggy. At different times we had gone through different situations to handle our backup servers efficiently. After all the hiccups with backup nodes, we ended up efficiently configuring 3 backup servers of 3 different configuration

  1. backup1 = It contains 12TB file system on a RAID 0 array. It copies data to a BTRFS compressed drive once a week to keep the data safe if RAID 0 dies. This server uses RAID 0 for faster drive verification and block scanning by r1soft. This server hosts servers that requires frequent backing up and can sustain a loss of a week data (Less important data). As the server performs really fast due to being RAID 0, we can run multiple r1soft threads at a time including disk safe verification and block scans.
  2. backup2 = It contains 30TB file system in RAID 6 hardware array. This is used for hosting our VPS backups. This server is a seriously large one to keep backups of our enterprise VPS clients.
  3. backup3 = It contains 16TB file system in RAID 10 hardware array. This server is hosted in a East Coast American Location. It is our off network backup server and keeps backups for East Coast servers too.

One of the key factor in designing a backup server is the size and the location. Need to keep in mind that CDP 3 takes more space than CDP 2 for unknown reason while still being a differential backup solution, not just an incremental. Location of the server matters due to the network speed. If you are hosting your server a lot far than the server network, it may take longer time to complete the initial storage. Due to the latency it may fails to perform as fast like 1Gbps even if both network supports it. Just for an example, if you are backing up your data at 1MBps speed, it would take 12.13 days to complete backup of 1TB data [ Calculation: (((1024 x 1024) / 60) / 60) / 24 = 12.13 days ]. A 100Mbps port can give you speed upto 10MBps, while you can have 50MBps+ speed if you are using a 1Gbps network roughly. So why does the speed matter? If you are backing up your initial data in 13 days, that doesn’t mean it will be the same all the time. Your second backup would take much less amount of time as it only needs to upload the differential backups. That is true! But the problem will come when you require to do a bare metal restore. If your server requires a disaster recovery, you would then need 13 days to restore your server to the original state. Your customers won’t sit down for 13 days! While creating backup, it is important to think about disaster recovery too. How fast are you going to be able to restore the backup is an important concern while designing your disaster recovery solution.

I always recommend users to choose a 1Gbps network with a latency below 2ms if you want to have a good disaster recovery solution. This can guarantee a faster bare metal restore when needed.

The second key factor while creating the R1soft backup server would be to choose the RAID. If you are thinking to create r1soft backup on a non-raided solution, I think you should drop off your idea. RAID isn’t necessarily always use to keep your data safe, it can also be used for performance. Keeping a RAID 0 or striping in general is must for a R1Soft server. Otherwise, every couple of times, you are going to see a lot of stalled processes doing ‘disk safe verification’ ‘block scan’ etc etc and not able to keep the backup up to date or canceling processes due to duplicate backup process (Old one taking too long to complete). It is better not to choose RAID 5. I particularly didn’t try RAID 5, but I have used RAID – Z on ZFS file system, which was seriously slow for my work around. I switched the server later on to RAID 0 and BTRFS compression to keep a weekly backup which tremendously improved the R1Soft performance. We at later time, worked to create more backup servers with hardware RAID WB cache and battery backed unit to give us more performance benefit while creating and restoring backups. These servers have been performing tremendously well with R1Soft. They can also be called good disaster recovery node.

Last, I recommend you to understand that backup isn’t just keeping a copy of your data of your online existence. It is important to design a disaster recovery solution instead of just creating backups. If you are simply into creating backups, you probably don’t need R1Soft or any high end servers instead simple Rsync would work fine. But to create ‘Disaster Recovery’ solution, you need high level planning, good hardwares and good cost estimation. If you are leaving behind in any, you will probably fail to create a good disaster recovery solution that actually ‘works’.

How to: Find dm number of a LVM logical volume

Sometimes, you will see the error thrown in dmesg or /var/log/messages are mentioned in dm-number format, while you manage the disk using lvm logical volume name. This is because lvm logical volumes are designed through kernel device mapper technique and kernel recognizes volumes using dm numbers. There is a tool to list all the device mappers used for block devices under Linux. Simply type the following to list the maps:

# lsblk

It shall show something like the following:

There you can see the dm number for each lvm volume is listed under first bracket. For example the swap in this server is created with LVM with the name vg_iof442/swap and has the dm-1 mapping.

How to: Find IOPS usage in a Linux Server

Question: How to find iops usage of a linux server?

Answer: Use iostat. Iostat is a tool comes with the ‘sysstat’ package. If you type iostat on your CentOS/Redhat server and it says the command not found, you can install sysstat to avail the iostat command.

yum install -y sysstat

An example iostat usage case could as simple as following:

iostat -x 1

-x tells iostat to give extended statistics which is required to find read/write iops individually. And the 1 tells iostat to repeat the command every 1s.

An example output would be like the following:

If you look at the output, the colum r/s would say the read iops and the colum w/s would say write iops. If you are using simple ‘iostat 1’ then the column tps should show the total iops of the disk in use.

If you are using a spinning disk, and if you are getting anything around 150-200 cumulatively, you are probably hitting the iops limit. With raid, the number would change according to your raid choice. Although, the number can increase in case of using Writeback SSD Cache, Hardware RAID Cache or Pure SSD disks. Most important benefit of using SSD is not essentially the amount of throughput it gives in a practical environment instead the amount of IOPS it can sustain is phenomenal.

Quick How To: Finding IO Abuser in KVM VM

I thought to write a quick how to on finding an abuser in a KVM VM Host. There is a tool shipped with libvirt is called ‘virt-top’. Virt-top  has many usage case. It can be used to detect the IO Abuser. Most of the cases, you would see the abuser is throwing a lot of IO Requests regardless of the amount of IO being written or read. Which is why, it important to first identify if you are hitting the IOPS limit of your disk or not by using iostat. A common tool I regularly use to identify first hand disk problem is iotop as well. The following is the favorite iotop command:

iotop -oaP

-o will only show the threads that are actually doing IO in the server instead of all the sleeping threads, keeping the iotop result clean. ‘P’ will show only the processes instead of every single threads. Each VM can have thousands of threads which will show up on the process ID. ‘a’ is specifically my favorite, that does accumulated output. It will show you the sum of the usage for the time your interactive iotop is running.

Once you are done with the first hand investigation, you may now use virt-top to detect the VM activity further. A most used command for me to detect IO abuser is the following:

virt-top -3 –block-in-bytes -o blockwrrq

-3 tells the virt-top to find block device usage and find them by ‘bytes’ while the -o ‘blockwrrq’ means to sort the output by the write iops of the VM. You can use blockrdrq to sort the result by read iops too.

Once you can mix the output of virt-top and iotop results, you shouldn’t have difficulty to detect the VM that is abusing the IO on the server.

How to Enable TXT Record Addition/Edition in Cpanel

By default, if you are trying to add TXT record from cpanel, you would probably see a screen like the following

It doesn’t show the option to add TXT record. Basically, cpanel won’t allow the cpanel users to add TXT record with Simple DNS Zone Editor permission. It allows adding A, CNAME & MX record with that feature/permission set. To add permission to add TXT record and other, you need to enable Advanced DNS Zone Editor for the user’s feature list. If the user is under default list, go to root WHM >> Feature Manager >> Edit Default Feature list and enable Advanced DNS Zone Editor as following:

What is Kondemand? Why do I see a lot of Kondemand process in my process list?

Question: What is Kondemand? Why do I see a lot of Kondemand process in my process list?

Answer: Kondemand is the process used for automatic CPU scaling on multi core linux system. It automatically reduce/drops the CPU clock speed to power usage when the CPU is not in use. This is done through scaling_governor available on linux. To see if your scaling_governor is set to ‘ondemand’ or not, you may use the following command:

# cat /sys/devices/system/cpu/cpu*/cpufreq/scaling_governor

If your CPU is showing ‘ondemand’ scanling governor then the kondemand kernel process is active and will reduce your CPU clock speed on fly to reduce power usage. You can change this settings to performance on fly using the following small shell code:

for CPUFREQ in /sys/devices/system/cpu/cpu*/cpufreq/scaling_governor; do [ -f $CPUFREQ ] || continue; echo -n performance > $CPUFREQ; done

There is a linux service called CPUSpeed, this can tune your scaling governor back to ondemand after the reboot. You may shut it down:

service cpuspeed stop
chkconfig off cpuspeed

You may check your CPU speed is restored to the original through the proc filesystem:

cat /proc/cpuinfo

Identifying File / Inode by Sector / Block Number in Linux

I had an interesting problem earlier today. While running r1soft backup, dmesg was throwing some I/O like the following:

Dec 28 09:28:43 ssd1 kernel: [36701.752626] end_request: I/O error, dev vda, sector 331781632
Dec 28 09:28:43 ssd1 kernel: [36701.755400] end_request: I/O error, dev vda, sector 331781760
Dec 28 09:28:43 ssd1 kernel: [36701.758286] end_request: I/O error, dev vda, sector 331781888
Dec 28 09:28:43 ssd1 kernel: [36701.760992] end_request: I/O error, dev vda, sector 331780864

They didn’t go out after multiple file system checks. That left me no choice other than finding what’s actually in that sector. I could see the sector numbers was increasing by 128 up 10 sequential logs. That makes to understand it could be a specific account causing the errors.

EXT file system comes with an interesting tool called debugfs. This can be used on mounted file system and can be used to track down IO related issues. Although, you require to do some calculation first to convert sector to block number of a specific partition before you can use debugfs.

The lowest sector number in the log was ‘331780864’. First I tracked down the partition where this sector lies. This can be done using fdisk -lu /dev/disk (Make sure to use -u, to ensure fdisk returns the sector numbers instead of cylinder number)

#fdisk -lu /dev/vda

Disk /dev/vda: 1342.2 GB, 1342177280000 bytes
16 heads, 63 sectors/track, 2600634 cylinders, total 2621440000 sectors
Units = sectors of 1 * 512 = 512 bytes
Sector size (logical/physical): 512 bytes / 512 bytes
I/O size (minimum/optimal): 512 bytes / 512 bytes
Disk identifier: 0x0002f013

Device Boot Start End Blocks Id System
/dev/vda1 * 2048 411647 204800 83 Linux
/dev/vda2 411648 205211647 102400000 83 Linux
/dev/vda3 205211648 209307647 2048000 82 Linux swap / Solaris
/dev/vda4 209307648 2621439999 1206066176 83 Linux

Now, find the Start Number < Our Sector number to detect which block contains our desired sector. In our case, it is /dev/vda4. Once done, we need to numeric sector number specifically for this partition, which can be done by subtracting our sector number with start number of the partition. In our case:

331780864 – 209307648 = 122473216

That means, our sector lies in 122473216th sector of /dev/vda4.

Now find the block size by tune2fs:

# tune2fs -l /dev/vda4 | grep Block
Block count: 301516544
Block size: 4096
Blocks per group: 32768

In our case, it is 4096.

Now determine the size of the sectors by bytes. This is shown in fdisk output:

Sector size (logical/physical): 512 bytes / 512 bytes

From the two relations block/bytes and sector/bytes, find sector/block : 512 / 4096 = .125

Now, calculate the block number of 122473216th sector: 122473216 x .125 = 15309152

We can now use debugfs to determine what file we have on that block number as following:

debugfs /dev/vda4

On the debug prompt, type:

debugfs: icheck 15309152

Block   Inode number
15309152   2611435

This will show the inode number of the desired file. Use the inode number to run:

debugfs: ncheck 15309152

Inode   Pathname
15309152 /lost+found/#29938847

This will show you the desired file that is actually causing the issue. In my case, I could find files that were corrupted in some old fsck, were stored in lost+found and they were missing magic number/incomplete files. Once I had deleted all the files from lost+found, my issue was resolved. Viola!