There are times, you may see the following error in your MySQL/MariaDB based Cpanel server:
[ERROR] Can't open and lock privilege tables: Table 'mysql.servers' doesn't exist in engine
The issue is most likely related to your Innodb tablespace got corrupted, and hence some tables under the mysql database got locked out as some of them use Innodb storage engine. One of the outcome of the symptom is, if you try to add a user to a database, it doesn’t add or show the green notification any longer in cpanel mysql databases section. Instead it just stops.
The only and best way to properly fix this would be restore the ‘mysql’ database or just the ‘servers’ table from your backup. If you don’t have one, you may just create the ‘servers’ table using the following SQL statement:
CREATE TABLE `servers` (
`Server_name` char(64) NOT NULL,
`Host` char(64) NOT NULL,
`Db` char(64) NOT NULL,
`Username` char(64) NOT NULL,
`Password` char(64) NOT NULL,
`Port` int(4) DEFAULT NULL,
`Socket` char(64) DEFAULT NULL,
`Wrapper` char(64) NOT NULL,
`Owner` char(64) NOT NULL,
PRIMARY KEY (`Server_name`)
) ENGINE=MyISAM DEFAULT CHARSET=utf8;
You may require to drop the table first. Now, if you can’t do this either, then there is only one way left, is to uninstall your MariaDB installation, and let Cpanel/WHM to install them for you.
Now, you may install the latest MariaDB from WHM >> MariaDB/MySQL Upgrade and proceed accordingly. This should install the latest for you with a fresh ‘mysql’ database for you. But it will not alter your other data files, means your other databases should be fine.
One thing, you need to remember, after a fresh mysql installation with the old data files, you will have the authorizations missing. You would have to recreate the database users manually to get the privileged table filled up.
If you are here, that means, you probably have panicked the same way, I did around 12 years back. I lost my ib_logfile0/ib_logfile1/ibdata1 all at once for a server that excessively utilizes Innodb tables. I had to recover vital data from the same situation today on a random request who does not have backups, and thought it is better to keep this as a document for future.
One key purpose of utilizing Innodb tables instead of MyISAM is that, the benefit on writes. It always outperform MyISAM in writes due to the use of extra efficient buffers. But, this also causes Innodb to vulnerable from crashing. As Innodb stores some sensitive data to 3 specific files, loosing them, also looses some serious mapping instruments for the database engines to recognizes Innodb table structure and data.
Who can follow this technique?
If you have lost any of ib_logfile0, ib_logfile1, ibdata1 or all of them, but still manages to keep the database folder intact with the .frm and .ibd files (which you would, if you have accidentally deleted the log file or the data only) and also have the following option NOT DISABLED in your mysql configuration ‘innodb_file_per_table’. This option is enabled by default, until you are explicitly disabling this to increase performance. A suggestion: only do this, if you keeping real time backups of your databases. Otherwise, it is better to have this enabled
What is ‘innodb_file_per_table’?
Primarily the tablespace stores and uses data from system tablespace for Innodb. But, as this creates a single point of failure from ibdata and log files, Innodb by defaults also stores the tablespace in table’s own data file, which is .ibd file. That means, if I lose the ibdata/logfile mappings, I can still use the .ibd file to restore my tablespace and do the schema to data mapping only if I allowed innodb to store these information to the database’s own .ibd file. You may read more about the parameters from MySQL documentation:
How to Recover an Innodb Table from database files only?
There are two steps to this process. One is to identify and recognize the database schema from the frm file and then basically find a way to import the tablespace from .ibd file and introduce it to innodb engine system tablespace.
First Step First: How to get the schema from .frm files?
First, you must install mysql-utilities tools to get access mysqlfrm tool, you may get the instructions to install this here:
Once this is done, now you have two options to read mysqlfrm files. My favorite way is to use the ‘diagnostic’ attribute. To achieve this, run the following:
I assumed, your database name is ‘your_database’ and the table you are trying to recover is ‘assets’. The above command will return you the schema of ‘CREATE TABLE’ you need to use. First, create a new database, and run this on the SQL console to generate the table first on the new database.
Second Step: Get your data and mapping back from .ibd to system tablespace
Once the database has the table, it will also create a .frm and .ibd file for you. What we need to do, is to first, make it forget the existing .ibd file it created, sync the .ibd file from our collapsed database, make the mysql innodb engine to recognize tablespace from the backup tablespace of this .ibd file and store & use it from system tablespace. These lines are complex, and might sound a bit difficult. No worry, let’s do it.
Run the following command first to let it forget the .ibd it has created now:
alter table assets discard tablespace;
Remember the following, our table name is ‘assets’. If you have a different table name, make sure to replace this accordingly. What this has done, is removed the assets.ibd file it created in /var/lib/mysql/new_database/ folder as we asked him to forget the existing .ibd file. Now we first need to copy the backup/old .ibd file to this location with the correct permission. I would use rsync to make sure permissions remains intact here:
Once this is done, we know, .ibd contains a backup of our original tablespace. We only need to make mysql & innodb recognize this. To achieve this, you may do the following from the Sql console:
alter table assets import tablespace;
If it throws a warning on not being able to file the .cfg file, you may forget it, because it is not essential to have a .cfg to recognize permissions/configurations.
If everything runs well, you should see your rows are back. It’s because innodb has now fetched your tablespace data from .ibd file to system tablespace and it can now recognizes the mapping to your data, viola! All you now need is to repeat the process for all of your innodb tables, and recover the whole database.
Mysql provides a set of utility tools that can be used to recover your data from Mysql data files. One of them is ‘Mysqlfrm’. This tool is not given in primary MySQL bundles, instead it comes with Mysql-utilities.
This package can be installed from ‘mysql-tools-community’ repo, those are available from MySQL Yum Repos
Command would be:
yum install mysql-utilities
This would also install another python package called ‘mysql-connector-python’ for you form the ‘mysql-connectors-community’ repo automatically. There is one catch. Sometimes, due to python version dependencies, you may fail to connect to mysql through the automatically detected mysql-connector-python that is automatically installed by mysql-utilities. You may know that if you are seeing the following error when you type mysqlfrom in the command line:
# mysqlfrm
Traceback (most recent call last):
  File "/usr/bin/mysqlfrm", line 27, in <module>
    from mysql.utilities.common.tools import (check_python_version,
ImportError: No module named utilities.common.tools
For these cases, you may install an older version of mysql connector for python, using the following before installing mysql-utilities:
yum install mysql-connector-python.noarch
This would install an older version of mysql connector that works better with Python 2.7 or similar.
Once the above is done, you may now install mysql-utilities using the following back again:
yum install mysql-utilities
As you have already installed the connector, this won’t try to reinstall the mysql connector from dependencies and use the other one that you got installed.
Now you may use the mysqlfrm tool to read your frm files and recover the table structures if required. Here is a great article from 2014 and still valid on mysqlfrm use cases:
Mailgun is a popular SMTP Relay/API service, one of my favorite. For transactional emails I have favored Mandrill before they declared to shutdown and later on merged with Mailchimp. Mandrill has cleaner network than any other services for transactional emails till this date. But what if, you need a smtp relay along with transactional emails? Mandrill fails there, as they can’t be entirely used as a SMTP relay. For those cases, I prefer Mailgun over Sendgrid, one of the main reason is, Sendgrid has poor network quality over Mailgun.
If you try to configure Sendgrid with Postfix, you will see, it will work without smtp_sasl_auth_enable set to true/yes. But this won’t be the case with Mailgun. To use Mailgun as smtp relay, you need to set the following in your main.cf file:
# set the relayhost to use 587 port of mailgun:
relayhost = [smtp.mailgun.org]:587

# set the authentication using static method:
smtp_sasl_password_maps = static:[email protected]:password
# you can get the smtp authentication from Sending >> Domain Settings >> Select Domain >> SMTP Credentials

# set sasl authentication on
smtp_sasl_auth_enable = yes

# set sasl security options to no anonymous:
smtp_sasl_security_options = noanonymous
Once these are done, you can save the file and restart postfix to start relaying with Mailgun. In cases, if you see the following error:
SASL authentication failed; cannot authenticate to server smtp.mailgun.org[34.224.137.116]: no mechanism available
Along with the following:
warning: SASL authentication failure: No worthy mechs found
This means, you are lacking the SASL authentication library for postfix or libsasl2 is not enough to cover the dependencies. To resolve this, you can install the cyrus-sasl libraries. You may do that using the following:
This would be a simple step by step post for the help of my customers. You require two tools for this.
i) putty – ssh client ii) WinSCP – File transfer client over SSH (You may use FTP or File manager as well)
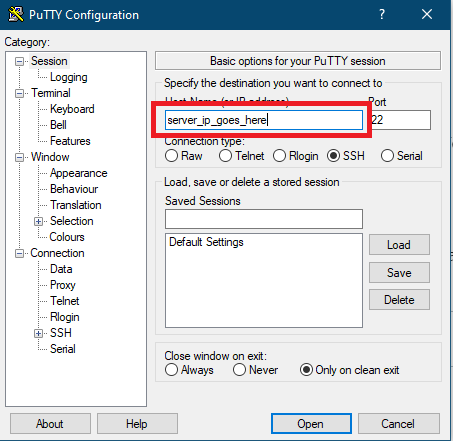
Once you download putty, open it, and use your server’s IP in the Host Name section:
Now, click on open. In the prompt, type ‘root’ as login as and enter. Then type the password and enter. If the password for the root is right, it will login to the command shell prompt or else it will put you in the authentication error console.
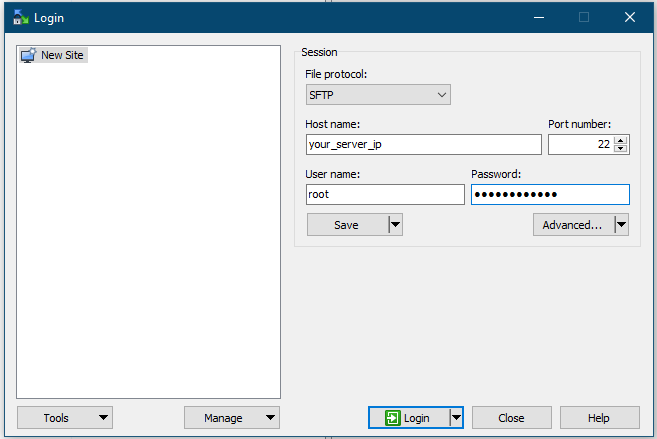
Now, open WinSCP to login to your server using the same manner of SSH. Once done, transfer your sql file to the home directory of root.
Login to your server using WinSCPWinSCP Transfer
To transfer the file, navigate the sql file from your desktop on the left side and then drag it to the right side of WinSCP window. That will start the transfer. Remember the path of the destination on the server. Path is shown in the red marked area in the image.
Once the file is transferred, come back to putty, and change directory to the path you had noted in WinSCP, in our case, it is /root/
cd /root/
mysql -uusername -ppassword your_database_name < your_sql_file_name.sql
Remember the following. Your mysql username should go right after ‘-u’ without any space and the mysql password should be the same without space. Replace the ‘your_database_name’ with your original database name in the server and ‘your_sql_file_name.sql’ with the exact sql file name that you had uploaded.
Now if you allow sometime, the command should complete after the restore. If it returns any error, you would need to attend them to do a complete restore.
There are cases, where Frontend developers wants to cancel the REST Requests that they submit using Ajax. It is one of the popular question among the Frontend developers community. Let’s try to focus on this case today.
To answer the question in short, No, you can not cancel a HTTP Request once it is submitted. There are catches require shear understanding here. Let’s elaborate a bit.
HTTP is Stateless by Design
HTTP is stateless by design, so what happens when there is no state for a request? It means we do not know the destination, what is happening with that specific requests at the back, but only can acknowledge the response. For example, if you have a REST API behind a load balancer. If you put a POST request to the API, you will not know which server going to serve your requests out of many HTTP servers behind the load balancer. For such cases, we create ‘cookies’ or ‘sessions’ on our application end for our full fledged web applications and extend the functionality of HTTP, to store state of a request and following it. For each form request for example, we submit a state along with the app, to let load balancer understand the state and follow me to the destination. Isn’t it? But we have to remember, this is not a HTTP feature, this is done at application level to add statefullness in HTTP requests.
What does this mean? It means, as there is no state for REST, we are not aware of the destination here, but only the response. So how can we cancel a requests, whose actual destination we are not aware of? Now you might think that, how about adding a cookies and cancel it? Yes, we do that on web applications layer, but can REST HTTP Requests be stateful? Not really, that is not by design of HTTP or REST unfortunately.
So, Does That Mean We Can Never Cancel an API Call?
If you are using REST, then it means you can never cancel the API call. If it gets submitted, it will continue processing in the backend even if you stop it in the frontend. But if ‘Cancelling’ is much important for your application through the API call, then you must consider other alternatives, like SOAP or RPC. RPC is stateful API architecture, and it is possible to design a cancel request for this. Please note, RPC doesn’t implement ‘cancel’ by default, but as this is stateful, you are able to design a ‘cancel’ request with the RPC call. Google has a RPC called ‘gRPC’, which is a stateful API architecture. That means, it is possible for you to implement cancel/abort or event rollback/restore a state with gRPC.
A Google application called ‘Firestore’ database has support for gRPC which is basically a stateful version of stateless REST API of Firestore.
You can run single command in a container using the following:
vzctl exec 201 service httpd status
How to find out all the VZ containers:
vzlist -a
The other way? Yes, there is. VZ list is stored inside a file /proc/vz/veinfo, and we can use it with the help of shell to run command in each VZ as following:
for i in `cat /proc/vz/veinfo | awk '{print $1}'|egrep -v '^0$'`; \
do echo "Container $i"; vzctl exec $i <your command goes here>; done
An example, can be the following:
for i in `cat /proc/vz/veinfo | awk '{print $1}'|egrep -v '^0$'`; \
do echo "Container $i"; vzctl exec $i service httpd status; done
Suppose, you have a live Ecommerce system. What you want to see, is how well your revenue is performing comparing to yesterday. But if you are comparing with the total revenue of yesterday, then this won’t be an efficient metric until you reach the end of the day. In real scenario, what you would like, is to compare it with the identical time it is happening right now. For example, if it is 7.19 PM now, then you want to compare either of the following two and show the trend:
i) Revenues within 00:00 – 7:00 PM yesterday to revenues within 00:00 – 7:00 PM today or ii) Revenues within 00:00 – 8:00 PM yesterday to revenues within 00:00 – 8:00 PM today (remember, it is 7.19 PM, so the counter and comparison will continue to flow when you get new order on this case)
Both of the way of seeing trend is useful, depends on your choice, but if you are comparing the metrics with the full of yesterday and the half way through to today, this might not be as useful.
How To Do This In Meatabase?
Please remember, I would be doing this in Metabase. Metabase is an open source data analytical and visualization tool written in Java. It is simple, fast and efficient tool for all square use cases in data analytics. I am using a ‘Reformatted’ real time MySQL database as the data source, hence the query can be used in plain MySQL databases to see results.
Note: We can’t do this with the simple query of Metabase, hence, we have to use the Native query support of Metabase. If your Administrator has limited your access to Metabase to Simple & Custom query, then you can not do this until your Administrator allows you so.
Building The Query
Let’s assume, our orders lie in ‘orders’ table, order creation dates are given in ‘date_created’ column, along with order status and the total value of the order is stored separately under status and total column.
First, we write the sum of the total column with the mysql aggregation function ‘sum’ and set a variable ‘date_created’ based the on the date_created column of orders table as following:
SELECT date(`orders`.`date_created`) AS `date_created`, sum(`orders`.`total`) AS `sum`
FROM `orders`
Now, if you want to use the ‘Trend’ in Metabase, then the query must have ‘Group By’ a timeseries based on which it shows the ‘Trend’ metrics. And we know, that our group by timeseries going to be ‘date_created’. We also know that our conditions of selecting the rows, going to be under the ‘WHERE’ statement, so we will keep it as blank for now. So the query, goes as following now:
SELECT date(`orders`.`date_created`) AS `date_created`, sum(`orders`.`total`) AS `sum`
FROM `orders`
WHERE (
# Our conditions will follow here
    )

GROUP BY date(`orders`.`date_created`)
ORDER BY date(`orders`.`date_created`) ASC
We are done with the basic. Now, let’s fill up the WHERE statement. First, you may want to filter out certain ‘status’ of the orders in case you have many. You first, fill that up as following:
SELECT date(`orders`.`date_created`) AS `date_created`, sum(`orders`.`total`) AS `sum`
FROM `orders`
WHERE (

        (`orders`.`status` = 'completed'
        OR `orders`.`status` = 'confirmed' OR `orders`.`status` = 'processing')
        )

    )

GROUP BY date(`orders`.`date_created`)
ORDER BY date(`orders`.`date_created`) ASC
In my case, we are filtering if the order status is either completed, confirmed or processing. We are discarding other statuses like on-hold, or pending or abandoned cart.
Now, let’s think for a moment. We have to compare two time series, that means, we have to first, create an identical time differences. Let me give an example for better understanding. If we are trying to find out, the revenues between 00:00 – 20:00 yesterday and 00:00 – 20:00 today, then we need to have two conditions in WHERE statement for each of them, and they should select all the rows from both conditions, which necessarily means, it would be a ‘OR’ statement. For both cases, we need to select the order statuses, that would necessarily mean something like the following:
SELECT date(`orders`.`date_created`) AS `date_created`, sum(`orders`.`total`) AS `sum`
FROM `orders`
WHERE (

        (`orders`.`status` = 'completed'
        OR `orders`.`status` = 'confirmed' OR `orders`.`status` = 'processing')
        )
Or
        (`orders`.`status` = 'completed'
        OR `orders`.`status` = 'confirmed' OR `orders`.`status` = 'processing')
        )

    )

GROUP BY date(`orders`.`date_created`)
ORDER BY date(`orders`.`date_created`) ASC
Does the above make sense? If not, soon enough it would be, let’s move on to the next step. Now, how can you align the time to match the hour we have now in SQL query? MySQL curdate() returns the current date, which is today at 00:00 So, if I know the difference of hours left for today, and subtract that from curdate(), that would give us the hour it is now with the date of yesterday. Here is the example:
This is 20th hour, so if we subtract 20 from 24, it would be 4. Now, we subtract 4 from curdate():
10-6-2020 00:00 - 4 Hour
09-6-2020 20:00
which basically is the same hour we are on, of today 10-6-2020 20:00 hour. Simple, isn’t it?
Now, how to write this in SQL query? Let’s see
First, we get 09-6-2020 00:00 Hour, this can be done as following in MySQL with negative Interval of 1 Day from current date.

date_add(curdate(), INTERVAL -1 DAY)

Next, we get 09-6-2020 20:00 Hour using the following:

date_add(curdate(), INTERVAL -(24 - hour(now())) HOUR)

See, how I am calculating the Interval Hour, I am using the MySQL function 'hour()' on another function 'now()' to get the hour we are on, which is giving me 20, then we are subtracting from 24 as 24 hours a day, the result is giving me 4 here. So the output going to be 20:00 hour.

Now, for today, we first need 10-6-2020 00:00 Hour, which is simply:

curdate()

then, the target time is basically the now() function:

now()
We now have all 4 parts of it, here is the completed statement going to be only for the time selections:
For Yesterday:

str_to_date(date_format(`orders`.`date_created`, '%Y-%m-%d %H'), '%Y-%m-%d %H')
 BETWEEN str_to_date(date_format(date_add(curdate(), INTERVAL -1 DAY), '%Y-%m-%d %H'), '%Y-%m-%d %H') AND str_to_date(date_format(date_add(curdate(), INTERVAL -(24 - hour(now())) HOUR), '%Y-%m-%d %H'), '%Y-%m-%d %H')

For Today:

str_to_date(date_format(`orders`.`date_created`, '%Y-%m-%d %H'), '%Y-%m-%d %H')
BETWEEN str_to_date(date_format(curdate(), '%Y-%m-%d %H'), '%Y-%m-%d %H') AND str_to_date(date_format(now(), '%Y-%m-%d %H'), '%Y-%m-%d %H')
By adding the above to our basic and simple status selection statements:
SELECT date(`orders`.`date_created`) AS `date_created`, sum(`orders`.`total`) AS `sum`
FROM `orders`
WHERE (

        (`orders`.`status` = 'completed'
        OR `orders`.`status` = 'confirmed' OR `orders`.`status` = 'processing' OR `orders`.`status` = 'on-hold')
        AND str_to_date(date_format(`orders`.`date_created`, '%Y-%m-%d %H'), '%Y-%m-%d %H')
        BETWEEN str_to_date(date_format(date_add(curdate(), INTERVAL -1 DAY), '%Y-%m-%d %H'), '%Y-%m-%d %H') AND str_to_date(date_format(date_add(curdate(), INTERVAL -(24 - hour(now())) HOUR), '%Y-%m-%d %H'), '%Y-%m-%d %H')

    OR

        (`orders`.`status` = 'completed'
        OR `orders`.`status` = 'confirmed' OR `orders`.`status` = 'processing' OR `orders`.`status` = 'on-hold')
        AND str_to_date(date_format(`orders`.`date_created`, '%Y-%m-%d %H'), '%Y-%m-%d %H')
        BETWEEN str_to_date(date_format(curdate(), '%Y-%m-%d %H'), '%Y-%m-%d %H') AND str_to_date(date_format(now(), '%Y-%m-%d %H'), '%Y-%m-%d %H')

    )

GROUP BY date(`orders`.`date_created`)
ORDER BY date(`orders`.`date_created`) ASC
Simple, huh? Indeed, it is. If you run this query in phpmyadmin, or your mysql console, you will see the revenue amounts from the yesterday till the hour we are running through at this moment of today. But in Metabase, you can get a beautiful ‘Trend’ number metric with it. Just go To Visualization >> Trends to show you the Trend Number Metric for this as following:
It is cool to see how good or bad you are doing by this hour than yesterday.
Well, this is an interesting topic. Earlier today, I answered the same question in a Elasticsearch Community Group in Facebook, thought to keep this documented as well.
Primarily, if you are aware of how Elasticsearch is storing data (The document like), you might think, it is a full fledged NoSQL database, but you need to know, it is not. If you have looked at several NoSQL databases, you might already be thinking, there is probably no standard definition of NoSQL databases, which is partially true, again, there still is definition of database management systems, where it doesn’t fit. Does that mean, we can’t use ES as the primary data store? No, that’s doesn’t mean that. You certainly can, but there are use cases. Let’s look at couple of points before we conclude.
Database Transactions
ES has no transaction. Even the algorithm that ES implements, Lucene Search, which has transaction in the original design, but ES doesn’t have any transaction. When there is no transaction, the first thing you need to remember, it has no rollback facility. That also means, every operation is atomic by design, and there is no way to cancel, abort or revert them. This also means, you have no locking standard in the system. If you are doing parallel writes, you need to be very careful about the writes here because ES is not giving you any guarantee to parallel writes.
ES Caching Strategy
Elasticsearch is a ‘near real’ time search engine. It is not a ‘real’ time search engine. It has a caching standard, that refreshes every 1 second. This is ‘by design’ of Elasticsearch. So, what’s the problem with it? The problem is, you may get tricked by the ES cache if you are immediately asking for a read for a quick write operation and it is within 1 second. But as most of the cases, ES is not written much often (Since most of the people do not use it as primary storage), most of the people thinks it is real time. But it is not. It’s cache can trick you in intense cases, where writes won’t be immediately available to you for read.
User Management
ES user management is no where near to a full fledged DBMS, only because ES doesn’t need to. They have never announced themselves as a NoSQL DBMS, hence they do not require to add the functionality in full square. They only implements the facilities that ES Ecosystems require.
So … ?
So, what does all these mean to you? If you have an extremely large read featured application, where updates are very rarely or occassionaly done, then you can definitely go with ES as your primary document storage engine. But if you have a write oriented application, requires complex user management or parallel threads require write access, then you better be choosing a standard DBMS for your business and use ES as secondary data store for your analytics and searches.
hmm, it’s a weird topic to write blog on. Because Cyberpanel comes with a built in Certbot, and can automatically detects www and without www to install SSL for. Then why am I writing this up? All because I found a VPS client today facing the issue. Even though, Cyberpanel was telling me that the SSL is issued, it was only issued for non-www domain, but the www domain left behind. Let’s see how can we resolve this.
First problem
First problem came up when I tried to discover the Cyberpanel certbot binaries.
Both of the certbot I could find from Cyberpanel was very old, Certbot has 1.4 version in the Epel which has support for Acme 2 challenge, while the one that Cyberpanel is using doesn’t. I hence decided to install a certbot for our case:
yum install epel-release
yum install certbot
These should be it for the latest version of certbot to start working in your Cyberpanel host. Once done, you may now generate the SSL using the following:
Remember to replace yourdomain.com with the actual one that is having problem with. Cyberpanel creates the home directory with the primary domain, so the remember to give the correct document root for the value of attribute ‘-w’.
Once this id done, certbot should automatically verify the challenge and get the issued license for you. Lets encrypt license are usually stored at the following directory:
If you had already created the SSL using Cyberpanel (which you must have done if you viewing this post), then remember, certbot will place the SSLs in /etc/letsencrypt/live/yourdomain.com-001/ folder. The name of the folder would be shown at the time you complete issuing SSL with certbot.
There are couple of ways you may use the SSL now. Either you may replace the old directory with the new, or just change the settings in either the vhost conf or the openlitespeed SSL settings. I find the easiest way is just to replace the old directory with the new. Something like this should work: